Data
Google Ads wasted spend statistics (2026): 8 studies
By the SpendCanary team · Figures checked 16 November 2026 · Reddit counts to 15 November 2026 · Download the CSV
How much Google Ads spend is wasted?
Google Ads wasted spend is about a third of the budget in the 3 recent studies, with data up to 2025: 34% to 39% of spend was counted as wasted. Older and smaller studies range from 15% to 61%. The numbers differ mainly because each study defines "wasted" differently, so the definition matters as much as the number.
Also on this page: how often these problems come up on Reddit each week.
- Median account's wasted spend (WordStream, 2025 data)
- $1,127.54 /month
- Share wasted, 3 recent studies
- 34%–39%
- Accounts with no conversions in 90 days
- 29%
- Spend with no search term shown
- 28%–51%
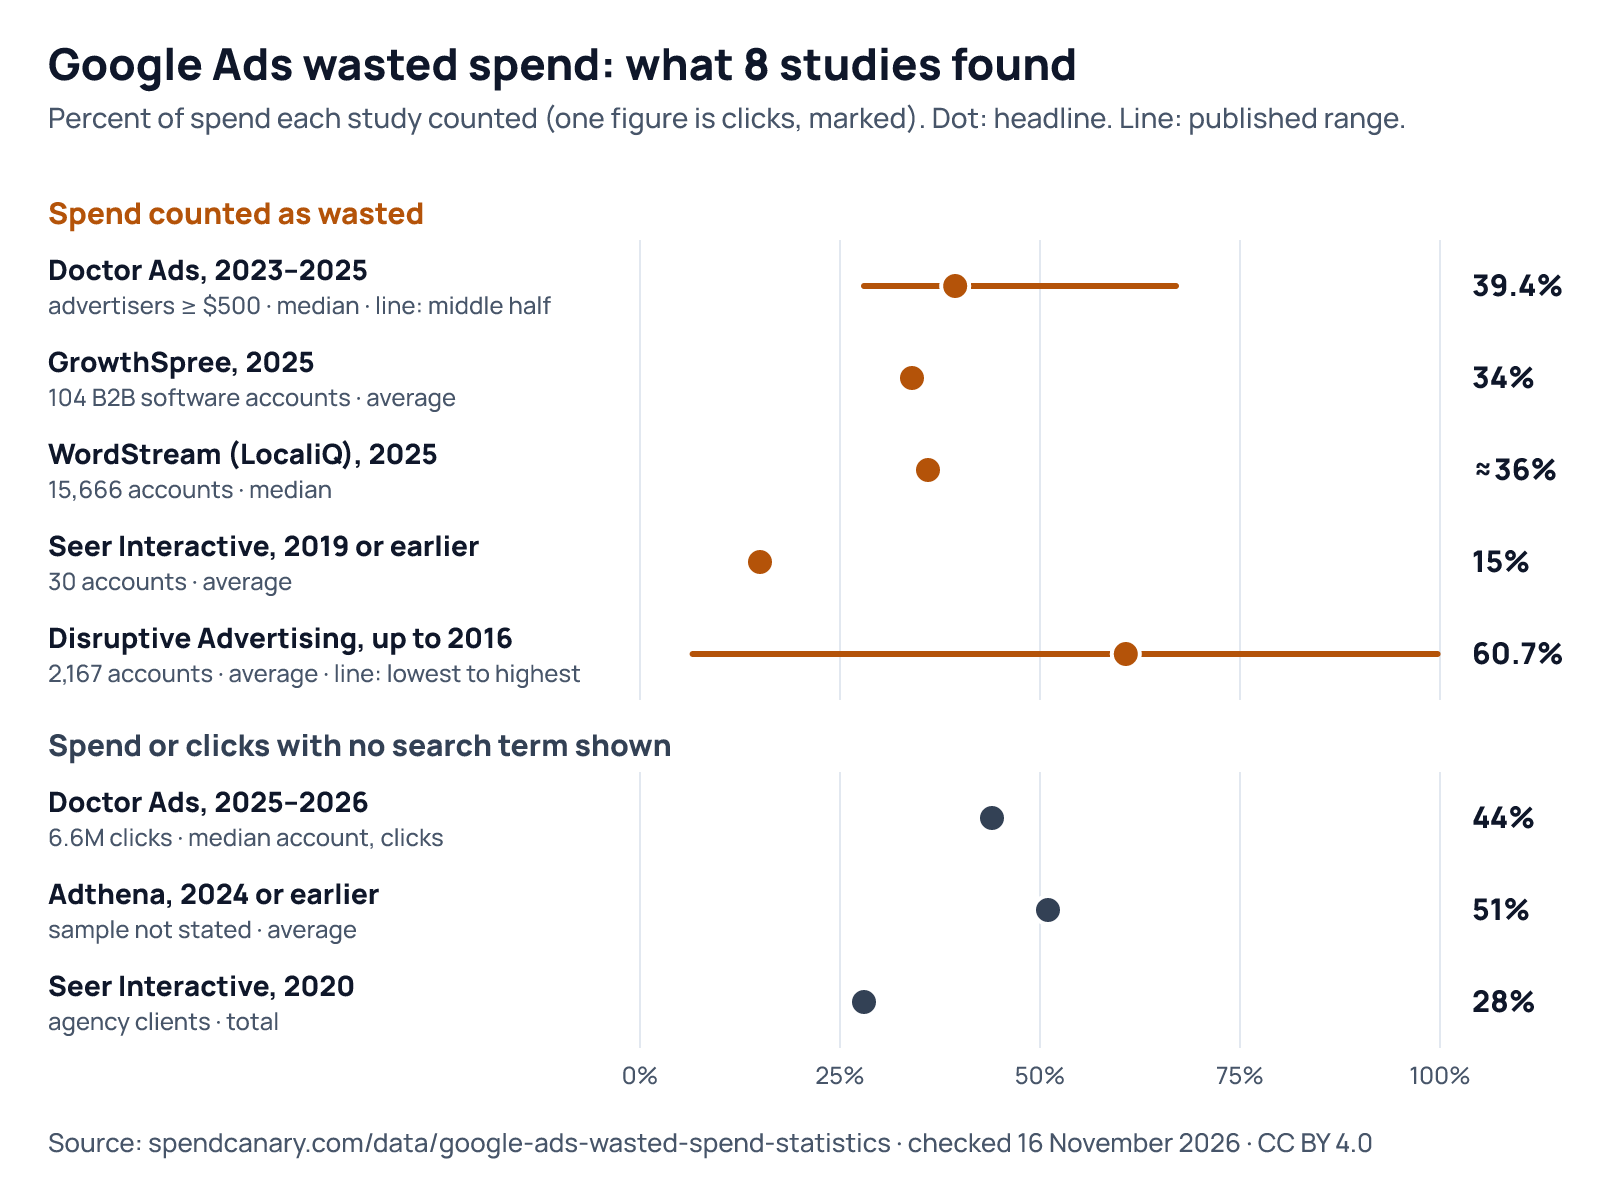
What 8 studies found
Percent of spend each study counted. Dot: the headline figure. Line: the published range, where there is one.
Spend counted as wasted
- Doctor Ads, 2023–2025 advertisers ≥ $500 · median · line: middle half 39.4% (middle half of advertisers: 28%–67%)
- GrowthSpree, 2025 104 B2B software accounts · average 34%
- WordStream (LocaliQ), 2025 15,666 accounts · median ≈36%
- Seer Interactive, 2019 or earlier 30 accounts · average 15%
- Disruptive Advertising, up to 2016 2,167 accounts · average · line: lowest to highest 60.7% (lowest to highest account: 6.6%–99.7%)
Spend or clicks with no search term shown
- Doctor Ads, 2025–2026 6.6M clicks · median account, clicks 44%
- Adthena, 2024 or earlier sample not stated · average 51%
- Seer Interactive, 2020 agency clients · total 28%
Key Google Ads wasted spend statistics
- The median Google Ads account wasted $1,127.54 a month in 2025 (WordStream, 15,666 accounts).
- The median advertiser spent 39.4% of tracked search-term spend on terms with no conversions; weighted by spend, 22.3% (Doctor Ads, 2023–2025).
- B2B software accounts wasted 34.0% of spend on average, about $26.5M across 104 accounts (GrowthSpree, 2025).
- Companies wasted 15% of their budget on irrelevant keywords, on average, across 30 accounts (Seer Interactive, 2019).
- In 2,167 audits up to 2016, 60.73% of spend went to search terms that never converted (Disruptive Advertising).
- 44.0% of the median account's search clicks fall in the unnamed "other search terms" row (Doctor Ads, 2025–2026).
- 51% of spend, on average, goes to search terms Google Ads doesn't show (Adthena, 2024).
- About 28% of spend lost its visible search term when Google hid low-volume searches in September 2020 (Seer Interactive, 2020).
Use this chart
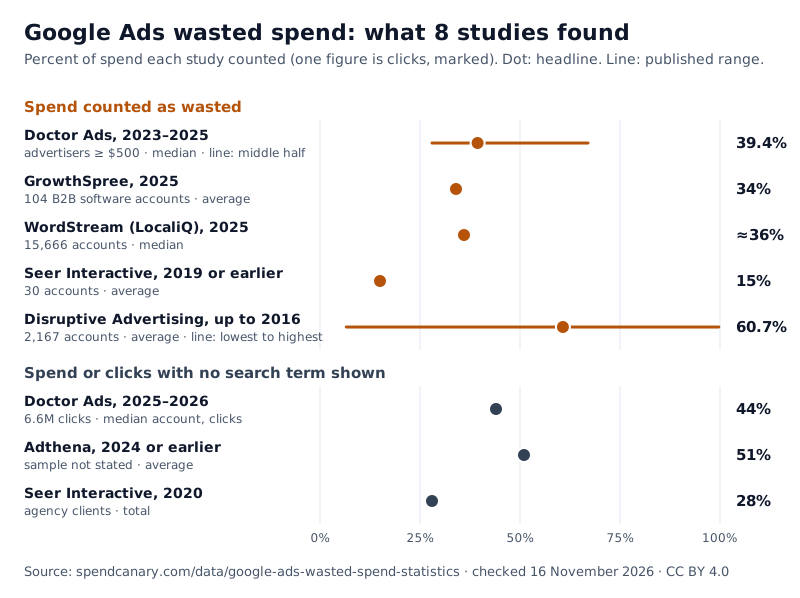
Free to reuse under CC BY 4.0: please credit SpendCanary and link to this page. The image already includes the source line.
Download PNG Download SVG Download CSV
Why do the studies disagree?
- They count different things. Disruptive Advertising and Doctor Ads count every search term with no conversions. Seer counted only irrelevant keywords, which gives a much lower 15%. GrowthSpree also counts form fills that never became a qualified sales lead, which only makes sense for B2B software.
- They look at different accounts. Agencies study their own clients or audit requests, usually accounts that already had problems. WordStream's comes from 251,236 account assessments run through its own tools. None of them is a random sample of advertisers.
- Median or average. A few accounts that waste nearly everything pull an average up or down. Disruptive's average was 60.73% but its median account wasted 75.80%; Doctor Ads' median was 39.4% but only 22.3% when weighted by spend, because big accounts waste a smaller share.
- Age. Disruptive's audits ended in 2016, before broad match, close variants and Performance Max changed how far ads reach. Treat it as history.
What does this mean for a small business?
If you've never checked, losing a quarter to a third of your spend on clicks that bring nothing is common. Not every search term without a conversion is waste: some clicks are people researching who buy later, or who phone you, which only shows up if conversion tracking works. The useful question is which searches cost you money and never bring a customer, and what they cost each month.
To find your own number, download your search terms report and paste it into the free Google Ads wasted spend calculator. It adds up every search term that cost money and brought no conversions. The free Google Ads wasted spend scan goes further and checks settings that send money to the wrong places, such as search partners and location targeting.
How much Google Ads spend is hidden from the search terms report?
Since September 2020, Google Ads hides search terms that few people searched for. Seer measured the change in its own clients' accounts: the share of cost with a visible search term fell from 98.7% to 71.0% overnight. Adthena puts the hidden share at 51% of spend, and Doctor Ads found 44.0% of the median account's clicks in the unnamed "other search terms" row. Whatever the exact share, part of your spend can't be checked term by term, so a search terms report always shows less waste than there is.
Every study, with its source
Newest first in each group. "Publisher sells" says what the publisher sells, because every one of these studies comes from a company with something to sell, us included.
Spend counted as wasted
Doctor Ads: 39.4% (median)
The median advertiser spent 39.4% on search terms with no conversions; the middle half ranged from 28% to 67%. Weighted by spend, 22.3%.
- Source
- How much of your Google Ads budget is wasted? (12 November 2026)
- Data
- 2023 to 2025, summed per advertiser
- Sample
- Advertisers with at least $500 of tracked search-term spend (number not stated)
- Counts as wasted
- Spend on search terms with zero recorded conversions, as a share of tracked search-term spend (tracked terms covered about 67% of search spend).
- Publisher sells
- Sells a fixed-fee account audit.
- Note
- The same page reports an earlier measurement: 6% to 40% across same-industry accounts, September 2024 to February 2025. We use its larger 2023–2025 figure.
GrowthSpree: 34% (average)
34.0% of spend on average, about $26.5M across the 104 accounts.
- Source
- The 2026 B2B SaaS Google Ads Waste Report (June 2026)
- Data
- Calendar year 2025
- Sample
- 104 enterprise B2B software accounts, $78.0M spend, from the agency's own audits
- Counts as wasted
- Spend on search terms that didn't convert, plus form fills that didn't become a sales-qualified lead within 90 days.
- Publisher sells
- B2B software marketing agency.
WordStream (LocaliQ): ≈36% (median)
$1,127.54 a month of wasted spend in the median account, which spent $3,127.38 a month. 36% is our ratio of the two medians; WordStream gives no percentage. 29% of accounts had no conversions in 90 days.
- Source
- Google Ads account study (23 February 2026)
- Data
- 1 January to 17 November 2025
- Sample
- 15,666 accounts in 23+ industries (251,236 account checks)
- Counts as wasted
- Clicks that brought no measurable return. The study doesn't give a formal definition.
- Publisher sells
- Sells Google Ads software and managed advertising.
Seer Interactive: 15% (average)
Companies wasted 15% of their budget on irrelevant keywords, on average.
- Source
- How to find wasted PPC spend in minutes (8 October 2019)
- Data
- Not stated
- Sample
- 30 paid search accounts
- Counts as wasted
- Spend on irrelevant keywords. The method isn't described.
- Publisher sells
- Digital marketing agency.
Disruptive Advertising: 60.7% (average)
60.73% of spend went to search terms that never converted; the median account was at 75.80%.
- Source
- Why Google Ads accounts succeed and fail (1 March 2016)
- Data
- Audits collected up to 1 March 2016
- Sample
- 2,167 accounts, over $320M spend, with working conversion tracking
- Counts as wasted
- Spend on search terms that never converted.
- Publisher sells
- PPC agency.
Spend or clicks with no search term shown
Doctor Ads: 44% (median, share of clicks)
44.0% of the median account's search clicks had no named search term; 29.9% of all clicks pooled.
- Source
- 44.0% of the median account's search clicks land in Google's leftover category (12 November 2026)
- Data
- January 2025 to July 2026
- Sample
- 6.6 million clicks from one agency's managed accounts
- Counts as wasted
- Share of clicks in the unnamed "other search terms" row. Clicks, not spend: that report has no cost column.
- Publisher sells
- Sells a fixed-fee account audit.
Adthena: 51% (average)
51% of spend, on average, was on search terms Google Ads doesn't show.
- Source
- How hidden search terms are impacting your Google Ads (7 October 2024)
- Data
- Not stated
- Sample
- Accounts in several countries (number not stated)
- Counts as wasted
- Share of spend on search terms Google Ads doesn't show, grouped as "other terms".
- Publisher sells
- Sells search competitor intelligence software.
Seer Interactive: 28% (total)
Cost with a visible search term fell from 98.7% to 71.0%, so about 28% of spend lost its search terms.
- Source
- Google Ads removes search terms for 28% of paid search budgets (2 September 2020)
- Data
- 31 August to 8 September 2020
- Sample
- All of the agency's clients (number not stated)
- Counts as wasted
- Share of cost with no search term shown, before and after Google's September 2020 change.
- Publisher sells
- Digital marketing agency.
How we picked and checked these studies
- In: public studies that say how many accounts they looked at, or how they measured, and give a share of spend.
- Out: round numbers like "20% to 40% of budgets are wasted" that appear in many blog posts with no data behind them, and studies of click fraud, which is a different question. We'll add new studies as they come out; tell us about one through support.
- Checked: we read every figure at its source on 16 November 2026 and link to it. Our percentages repeat each study's own, except WordStream's ≈36%, which is our ratio of its two medians: $1,127.54 of wasted spend and $3,127.38 of monthly spend. WordStream gives no percentage.
- Not ours: none of these figures comes from SpendCanary customers' accounts. For a different kind of data, see how often each Google Ads problem came up in 9,643 Reddit posts.
Which Google Ads wasted spend problems come up on Reddit each week?
Public posts in the Google Ads subreddits that mention each problem, per week. Last week (9 November 2026 to 15 November 2026) had 163 Google Ads posts in all. Counted every day; the average covers the 11 weeks before. Bars show each week, the latest in amber; each chart is scaled to its own highest week.
-
Money spent with no results 5 posts last week (average 4.5)
Last 4 weeks: 19 Oct: 2 · 26 Oct: 5 · 2 Nov: 6 · 9 Nov: 5
-
Broad match and irrelevant searches 6 posts last week, up from an average of 5.2
Last 4 weeks: 19 Oct: 3 · 26 Oct: 6 · 2 Nov: 2 · 9 Nov: 6
-
Search Partners and Display 1 post last week (average 2)
Last 4 weeks: 19 Oct: 6 · 26 Oct: 1 · 2 Nov: 2 · 9 Nov: 1
-
Spent more than the budget 2 posts last week (average 0.5)
Last 4 weeks: 19 Oct: 1 · 26 Oct: 0 · 2 Nov: 0 · 9 Nov: 2
-
Click fraud and bots 1 post last week (average 1)
Last 4 weeks: 19 Oct: 2 · 26 Oct: 0 · 2 Nov: 1 · 9 Nov: 1
-
Location targeting 0 posts last week (average 0.7)
Last 4 weeks: 19 Oct: 0 · 26 Oct: 2 · 2 Nov: 0 · 9 Nov: 0
-
Google changing the account 6 posts last week (average 4.2)
Last 4 weeks: 19 Oct: 4 · 26 Oct: 4 · 2 Nov: 7 · 9 Nov: 6
-
Performance Max spending on brand searches 0 posts last week (average 0.8)
Last 4 weeks: 19 Oct: 0 · 26 Oct: 1 · 2 Nov: 0 · 9 Nov: 0
Download chart (SVG) Daily history (CSV) Daily history (JSON)
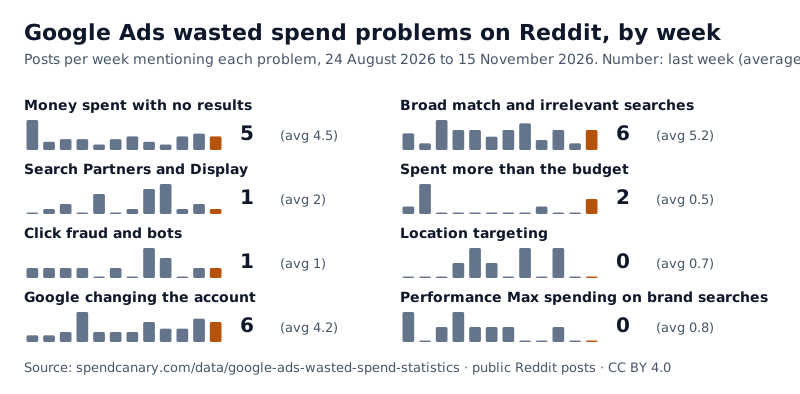
What these counts can't tell you: they measure how often a problem is mentioned, not how many advertisers have it or what it costs. A busy week can be one viral thread. Public posts are matched with the same words as our yearly count of 9,643 posts; we keep totals only, never the posts or usernames. Recent days are recounted for three days as late posts arrive.
How to cite these statistics
Quote the figures, use the chart or the CSV under CC BY 4.0: credit SpendCanary and link to this page. The licence covers our table and chart; each study belongs to its publisher, so cite them too. A ready-made citation:
SpendCanary (2026). Google Ads wasted spend statistics. https://spendcanary.com/data/google-ads-wasted-spend-statistics (figures checked 16 November 2026).